
Has anyone else been looking at the numbers on COVID-19 and feel the need for a crash course in statistics?
There is a lot of information disseminated through various websites. Many of these numbers are contradictory and it’s difficult to get a clear picture of the prevalence and impact of the virus. However, you don’t have to be a supersleuth to understand the official data. You just need a little time, some background information and some critical thinking.
Disclaimer: Data for this article are from the Virginia Department of Health’s (VDH) COVID-19 in Virginia website and the United States Census Bureau as of June 8, 2020. These data are recalculated based on test results reported by 5 p.m. the previous day and updated by 10 a.m. the following day.
About the Numbers
Before we dive into how to translate the official reports of cases, hospitalizations and deaths due to COVID-19 as reported on the VDH website, here are a few things to keep in mind:
- Overall percentages are largely based on the number of people tested in a given area, not the total population of the area. As of this week, 11.5 percent of tests conducted in Virginia have returned a positive result, or a little more than 1 in 10 tests. Only 3.8 percent of Virginians have been tested, or fewer than 1 in 26 people.
- It is extremely difficult to estimate the total number of people infected in the U.S. for two reasons: A majority of people who have the virus are asymptomatic ― show no signs of the virus ― and therefore do not get tested; and until recently, only people who show symptoms of COVID-19 have been able to access the very limited supply of tests.
In sum, estimates can only be based on available data — the number of tests.
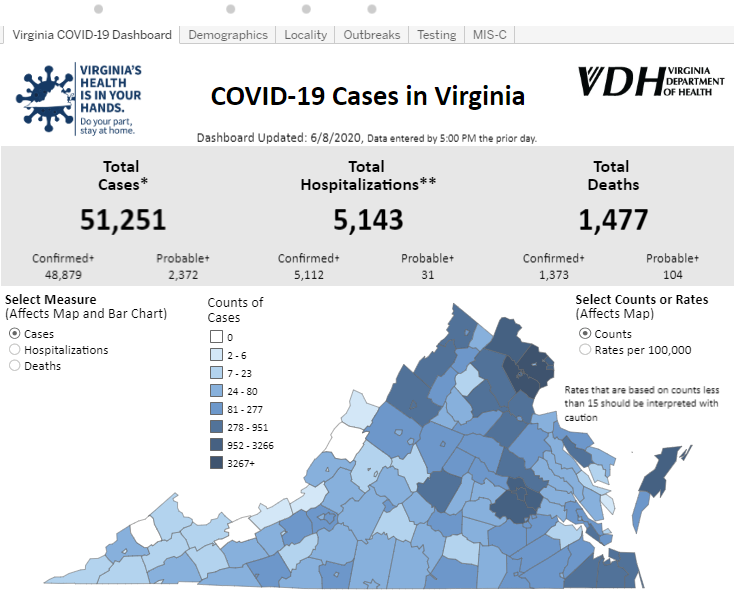
This graphic represents the number of total cases in Virginia as of June 6th. Use “Select Counts or Rates” to toggle between “Counts” and “Rates per 100,000.” Use the tabs at the top to navigate to the different sections.
How Data is Reported
States and the District of Columbia report their cases to the CDC’s National Notifiable Diseases Surveillance System, a program which monitors, supports and standardizes data across the U.S. By law, local hospitals and other medical care facilities must report data to their health districts, which in turn is uploaded to the central network system. The figures on the VDH website are from this system.
Common Terms
The number of total cases for the CDC and the VDH are separated into two categories: “confirmed” are individuals who have tested positive for COVID-19 at least once; “probable” are individuals who have displayed symptoms of COVID-19 and have been in contact with a known infected person, but have not been tested.
Rates per 100,000
What’s important to observe here is that the default view for the VDH is “counts” or how many total cases, hospitalizations and deaths in a given area (zip code, city, county, et cetera).
For example, Fairfax County reports 12,603 total cases and the Eastern Shore (Northampton and Accomack Counties) reports 1,238 total cases. It would seem at first glance that someone living in Fairfax has a higher chance of contracting the virus than the Eastern Shore because there are more people confirmed with the virus.
However, to get a better understanding of the prevalence of the virus, look at an area’s “rates per 100,000.” This is the number of positive tests that are likely to exist for every 100,000 people tested in that area. It’s a statistician’s way of comparing two areas with different population sizes.
The information is also available by hovering over a section of the Virginia map on the VDH COVID-19 page. This rate is calculated by dividing the total count by the population of the area, then multiplying by 100,000 or moving the decimal point to the right five places.
Fairfax has a rate of 1,095, where the Eastern Shore has a rate of 2,602 ― more than twice as many cases per 100,000. Why the difference? Fairfax has a population of over 1.1 million. The Eastern Shore has a population of only 43,786.
Virginia Department of Health
The Virginia Department of Health’s COVID-19 in Virginia is the main reporting page. At the top of the graphic are six tabs, each with a specific focus:
- The “Virginia COVID-19 Dashboard” provides an interactive overview of the number of cases, hospitalizations and deaths by county. Remember to select “Rate per 100,000” to accurately compare counties.
- “Demographics” provides age, race, gender and ethnicity data for all or each of the health districts in Virginia. Note: Race is not reported for 32 percent of confirmed positive tests.
- “Locality” provides cases, hospitalizations and deaths due to COVID-19 by county. This can be adjusted to show counts as well as rates by 100,000.
- “Outbreaks” provides data on “the occurrence of more cases of disease than expected” from “any residential or day program, service or facility licensed or operated by any agency of the Commonwealth, school, or summer camp.” This information is organized by health district and under five main categories.
- “Testing” provides the number of tests conducted in Virginia. Currently, PCR is the widely used test for COVID-19.
- “MIS-C” provides information on a multi-system inflammatory syndrome in children which has been linked to COVID-19.
Remember, data do not lie. The quality of data, and what we do with them, determines our reality. With everything going on in our communities right now, it’s important to educate ourselves with the right information.